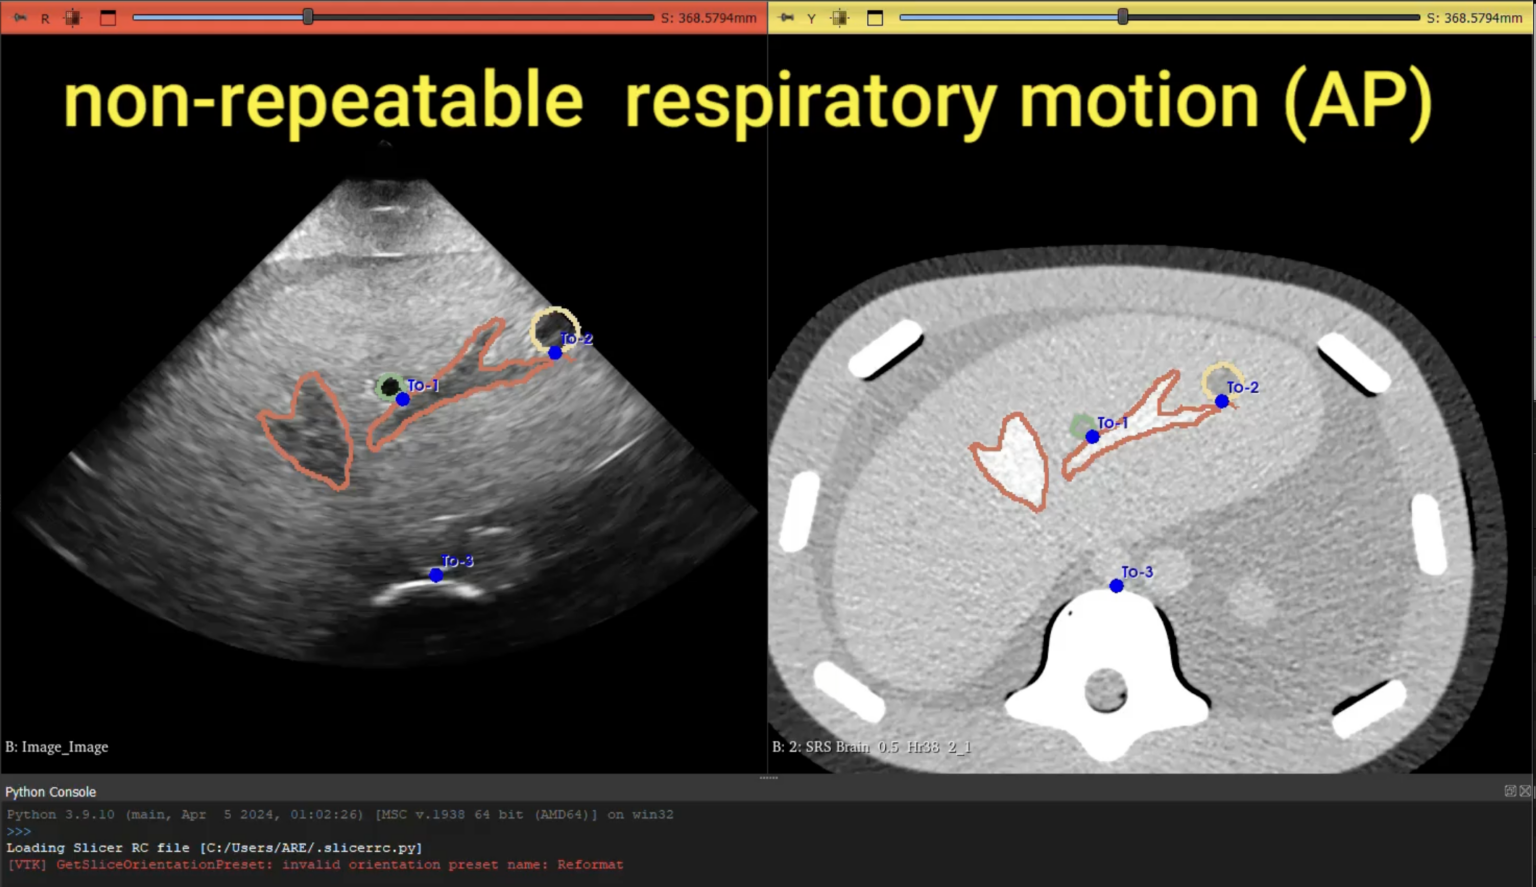
See latest tARV results in the Red Journal
Offline Analysis
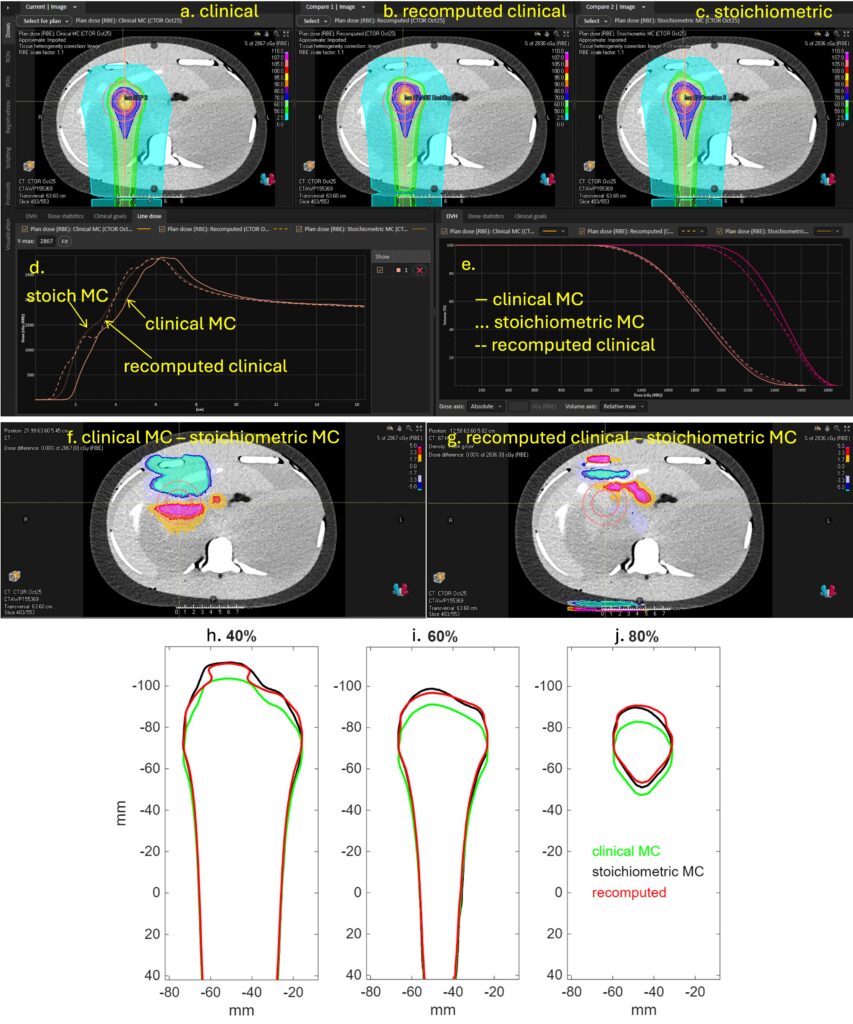
Dosemap comparison: clinical Monte Carlo (a), recomputed from thermoacoustic estimates (b), gold-standard stoichiometric (c).
Dose profiles through isocenter (d) and DVHs(e), plotted with clinical MC, stoichiometric MC and recomputed clinical in solid, dotted, and dashed lines respectively.
Dose differences (f-g).
40%, 60%, & 80% isodose lines (h-j).
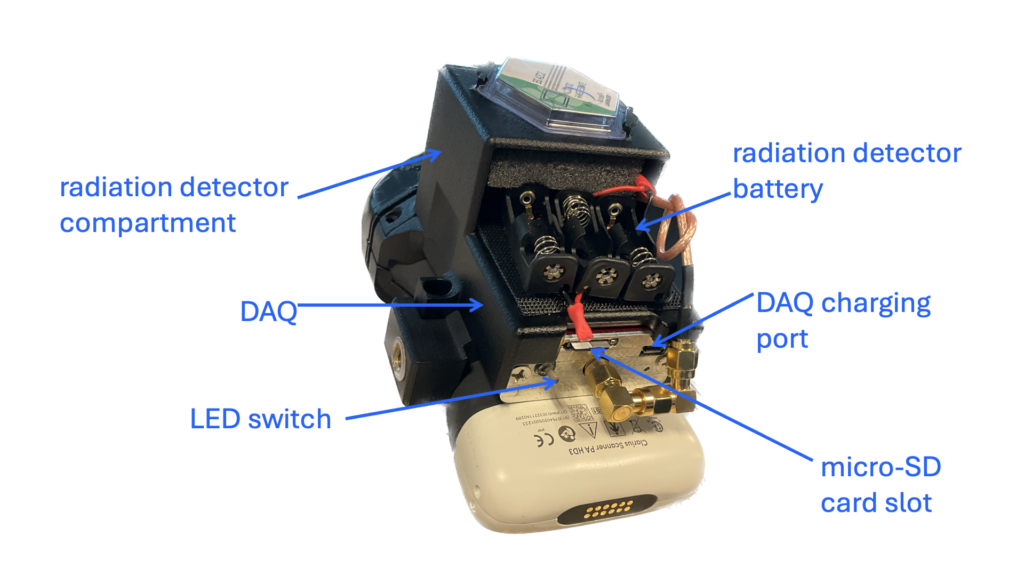
thermoAcoustic Range Verifier (tARV)
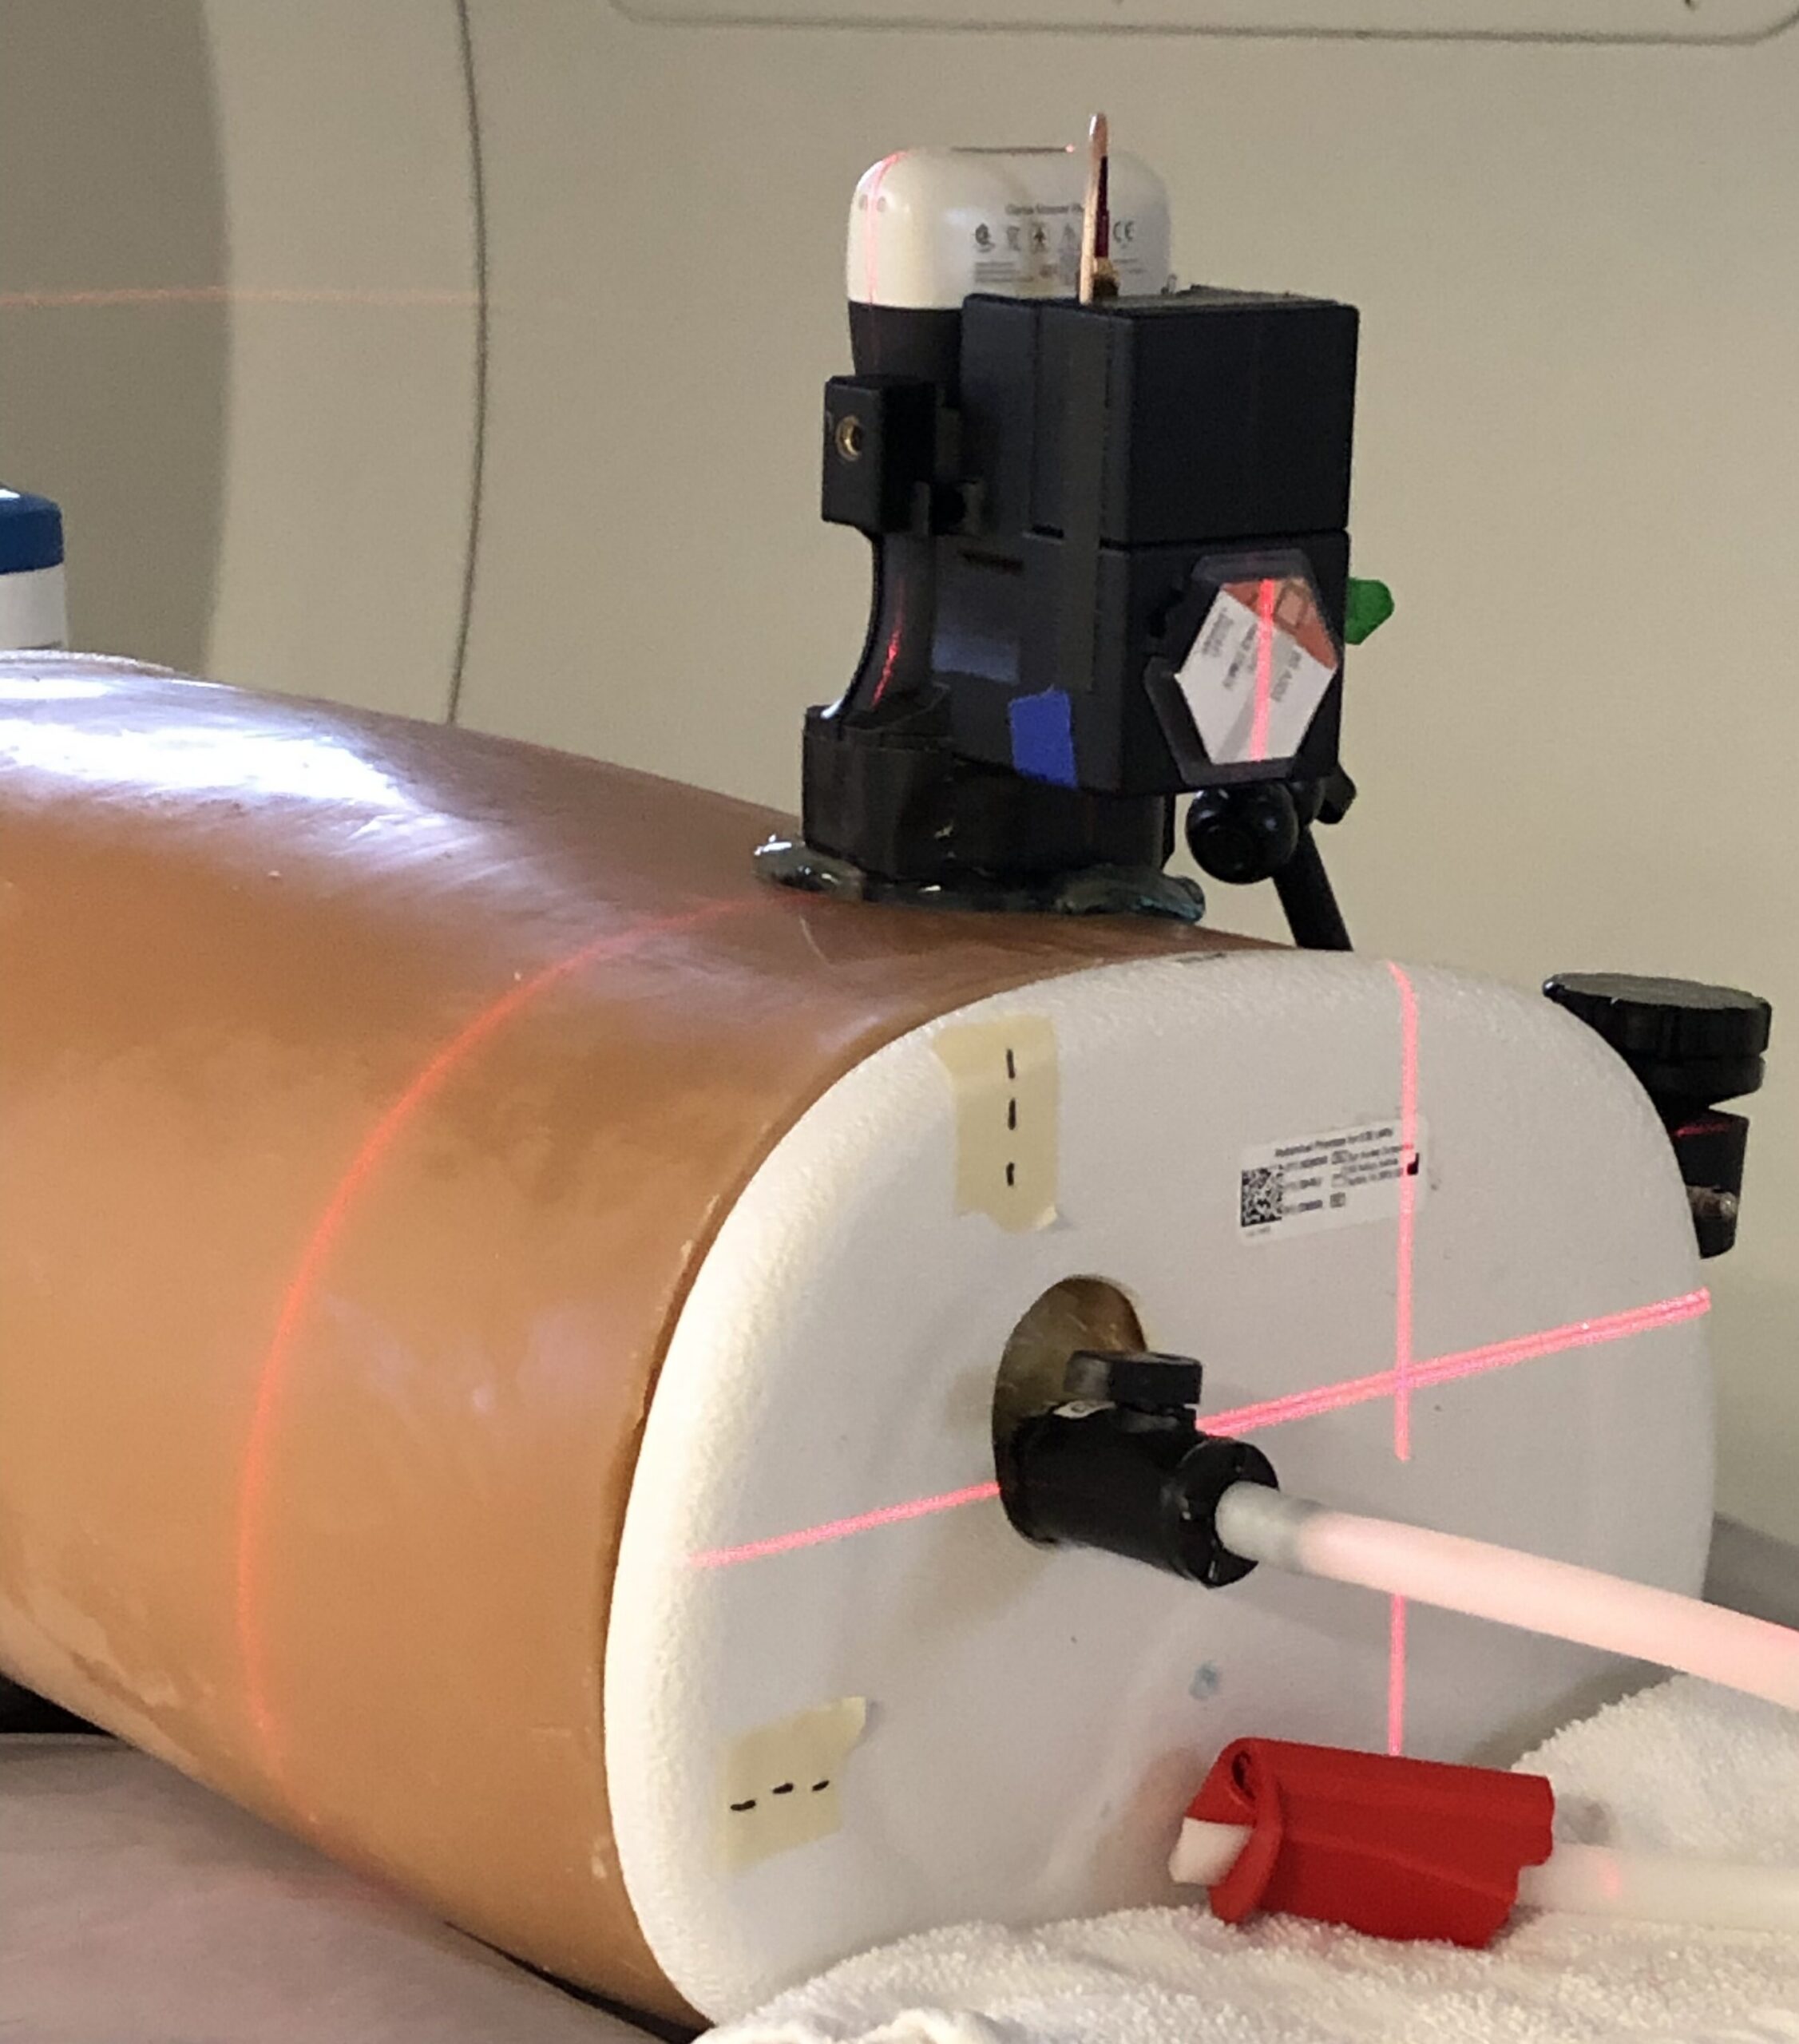
tARV Measurement Setup
Monitor Motion with Ultrasound